Five Signals That Tell You an Ad Creative Is Working — Before the Conversions Do
Waiting for conversion data means waiting a week and spending the budget to get it. These five signals appear within days and tell you most of what you need to know.
Short answer: Do not wait for conversion rate. Five earlier signals are readable within hours to a few days: video hold rate, CTR against your own baseline, the gap between link clicks and landing page views, scroll depth and time to first interaction, and CTR falling as frequency rises. Use them to kill clear failures by day two.
Conversion rate is the metric that matters and the worst one for making decisions quickly. On a normal budget, a new creative needs several days and a few hundred clicks before its conversion rate means anything. Act sooner and you are reading noise. Wait longer and you have spent the test budget finding out.
The way out is not to guess earlier. It is to read the signals that stabilise first — the ones that tell you why a creative will or will not convert, and that reach significance long before conversions do.
Here are the five we watch, roughly in the order they become readable.
1. Hold rate, not view count
Available: within hours.
For video, the metric that predicts performance is not views or even completion. It is the drop from the first second to the third.
Almost everyone loses a large share of viewers in the first three seconds — that is the scroll reflex, not a judgement of your ad. What matters is the shape of the curve after it. A creative that loses most of its audience by second three and then holds the rest steadily has found its people. One that keeps bleeding viewers evenly through its runtime has not made its point.
Compare that curve against your account average rather than an industry benchmark. Benchmarks are averaged across creatives, offers and audiences that have nothing to do with yours.
What to do: if the drop-off is even rather than front-loaded, the problem is usually the middle of the ad, not the hook. You are opening well and failing to justify continued attention.
2. Click-through rate against your own baseline
Available: within a day, on reasonable spend.
CTR is the most-quoted early metric and the most misread, because it gets compared to numbers from other people’s accounts.
CTR is a function of your offer, your audience, your placement and your creative — all four. A 1.2% CTR might be excellent in one context and poor in another. The only comparison worth making is against your own recent creatives in the same placement to the same audience.
The useful pattern is the relationship between CTR and cost per click. A creative with high CTR and high CPC is winning attention but competing in an expensive auction. High CTR with falling CPC means the platform is rewarding you with cheaper inventory — that is the compounding one, and it is usually visible before any conversion data arrives.
What to do: treat a sharp CTR rise with flat conversion rate as a warning, not a win. It usually means the creative is promising something the landing page does not deliver.
3. The gap between clicks and landing page views
Available: immediately.
This is the most underused number in paid media, and it costs real money.
Every platform reports both link clicks and landing page views. The gap between them is people who tapped your ad and left before the page rendered. On mobile, on an ordinary connection, that gap is routinely twenty to thirty percent. Occasionally it is far worse.
You are paying for every one of those clicks.
A widening gap is almost never a creative problem. It is page weight, a slow redirect chain, a consent banner that blocks rendering, or a tracking script loading before content.
What to do: measure this before you test creative at all. Fixing a 30% drop-off is a larger and more permanent win than anything a new headline will do, and it improves every campaign you run afterwards rather than just this one.
4. Scroll depth and time to first interaction
Available: within a day, and independent of conversion volume.
Once someone reaches your page, two behavioural numbers tell you most of what conversion rate will eventually say — and they need far less traffic to be readable, because every visitor produces them.
Scroll depth tells you where attention dies. If most people never reach your form, the form is not the problem.
Time to first interaction — how long before someone scrolls, clicks or focuses a field — tells you whether the page connected. A long delay followed by an exit means the page did not match what the ad promised. A quick scroll followed by a long dwell partway down means something midway is doing the work, and probably deserves to be higher up.
What to do: if scroll depth collapses in the same place across creatives, the fault is the page, not the ads. Move your strongest proof above that point.
5. Frequency against the CTR trend
Available: from day three or four.
Creative fatigue is predictable and most teams catch it late, after cost per acquisition has already risen.
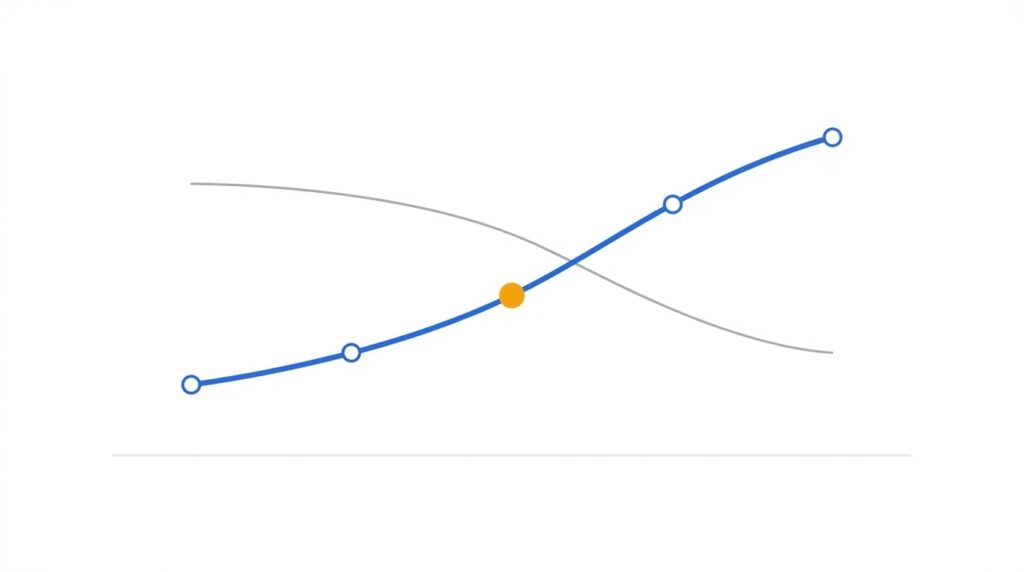
Watch frequency and CTR on the same chart. While frequency climbs and CTR holds, the creative still has room. The moment CTR begins declining as frequency rises, fatigue has started — and CPA will follow within a few days, because the platform is now paying more to show a creative people are ignoring.
This turning point is visible well before the CPA damage lands. Fatigue also arrives faster than most expect on narrow audiences: a tight retargeting pool can exhaust a creative in under a fortnight, while a broad prospecting audience may run for months.
What to do: treat the CTR-versus-frequency crossover as your refresh trigger rather than a fixed schedule. It adapts to audience size automatically, which a calendar does not.
Putting it together
None of these signals is conclusive alone. Read together, in order, they diagnose rather than just measure:
| What you see | What it usually means |
|---|---|
| Poor hold rate, poor CTR | Creative is not landing. Change the hook. |
| Good CTR, big click-to-view gap | Page speed. Fix before testing anything else. |
| Good CTR, shallow scroll | Message mismatch between ad and page. |
| Good scroll, no conversion | The offer or the form. Not the creative. |
| CTR falling as frequency rises | Fatigue. Refresh now, not next month. |
The pattern worth noticing: three of the five point at the landing page, not the ad. That matches what we see in practice. Most campaigns described as a creative problem are a page problem, and teams iterate on ads for weeks because ads are the thing they are used to changing.
What this changes about testing
If you read these signals in order, a test stops being one week-long question and becomes a sequence of quick ones:
- Day 1 — is the page fast enough to be worth sending traffic to?
- Day 1–2 — is the creative earning attention relative to our own baseline?
- Day 2–3 — do people who arrive engage with the page?
- Day 4+ — is fatigue starting?
- Day 5–7 — and only now, what is the conversion rate?
You still need conversion data before scaling. But you will have killed the clear failures on day two rather than day seven, and the budget that would have funded them goes into the creatives that showed early promise.
That is the whole benefit. Not better prediction — faster elimination.
Frequently asked questions
How soon can I judge a new ad creative?
Conversion rate needs several days and a few hundred clicks. Hold rate, CTR against your own baseline and the gap between clicks and landing page views are readable within hours to a day, and creative fatigue shows from around day three or four.
What is a good CTR for ads?
There is no universal figure. CTR depends on your offer, audience, placement and creative, so compare it only against your own recent creatives in the same placement and audience, and read it alongside cost per click.
Why are my link clicks higher than my landing page views?
The gap is people who tapped the ad and left before the page rendered. On mobile it is routinely 20–30%. The cause is usually page weight, redirect chains, a consent banner or tracking scripts, and it is worth fixing before you test any creative.
How do I know when an ad creative is fatigued?
When CTR starts declining while frequency keeps rising. CPA usually follows within a few days. Narrow retargeting audiences can exhaust a creative in under a fortnight, while broad prospecting audiences can run for months.
If CTR is high but conversions are low, is the creative the problem?
Usually not. It typically signals a mismatch between what the ad promises and what the landing page delivers. Three of the five early signals point at the landing page, not the ad.
Where to go next
Early creative signals tell you which ad to keep. They do not tell you what the account can afford to pay — for that, work out what a good ROAS looks like on your own margins. And if you are wondering how much of this monitoring can run without you, the test for what to automate puts alerting firmly in the safe column and creative judgement firmly outside it.
Reading creative signals well is one discipline of four. Whether you build that capability in-house or buy it is a separate calculation — and if you are buying, these are the questions worth asking.
ThynqAi runs paid media as a measurement problem first. If your campaigns are producing clicks but not customers, we will tell you which of the five it is.